You might already be aware of the many benefits of conducting in-store research in a digital twin of a physical store. But what comes next? How do you analyze, view and share the data from your study?
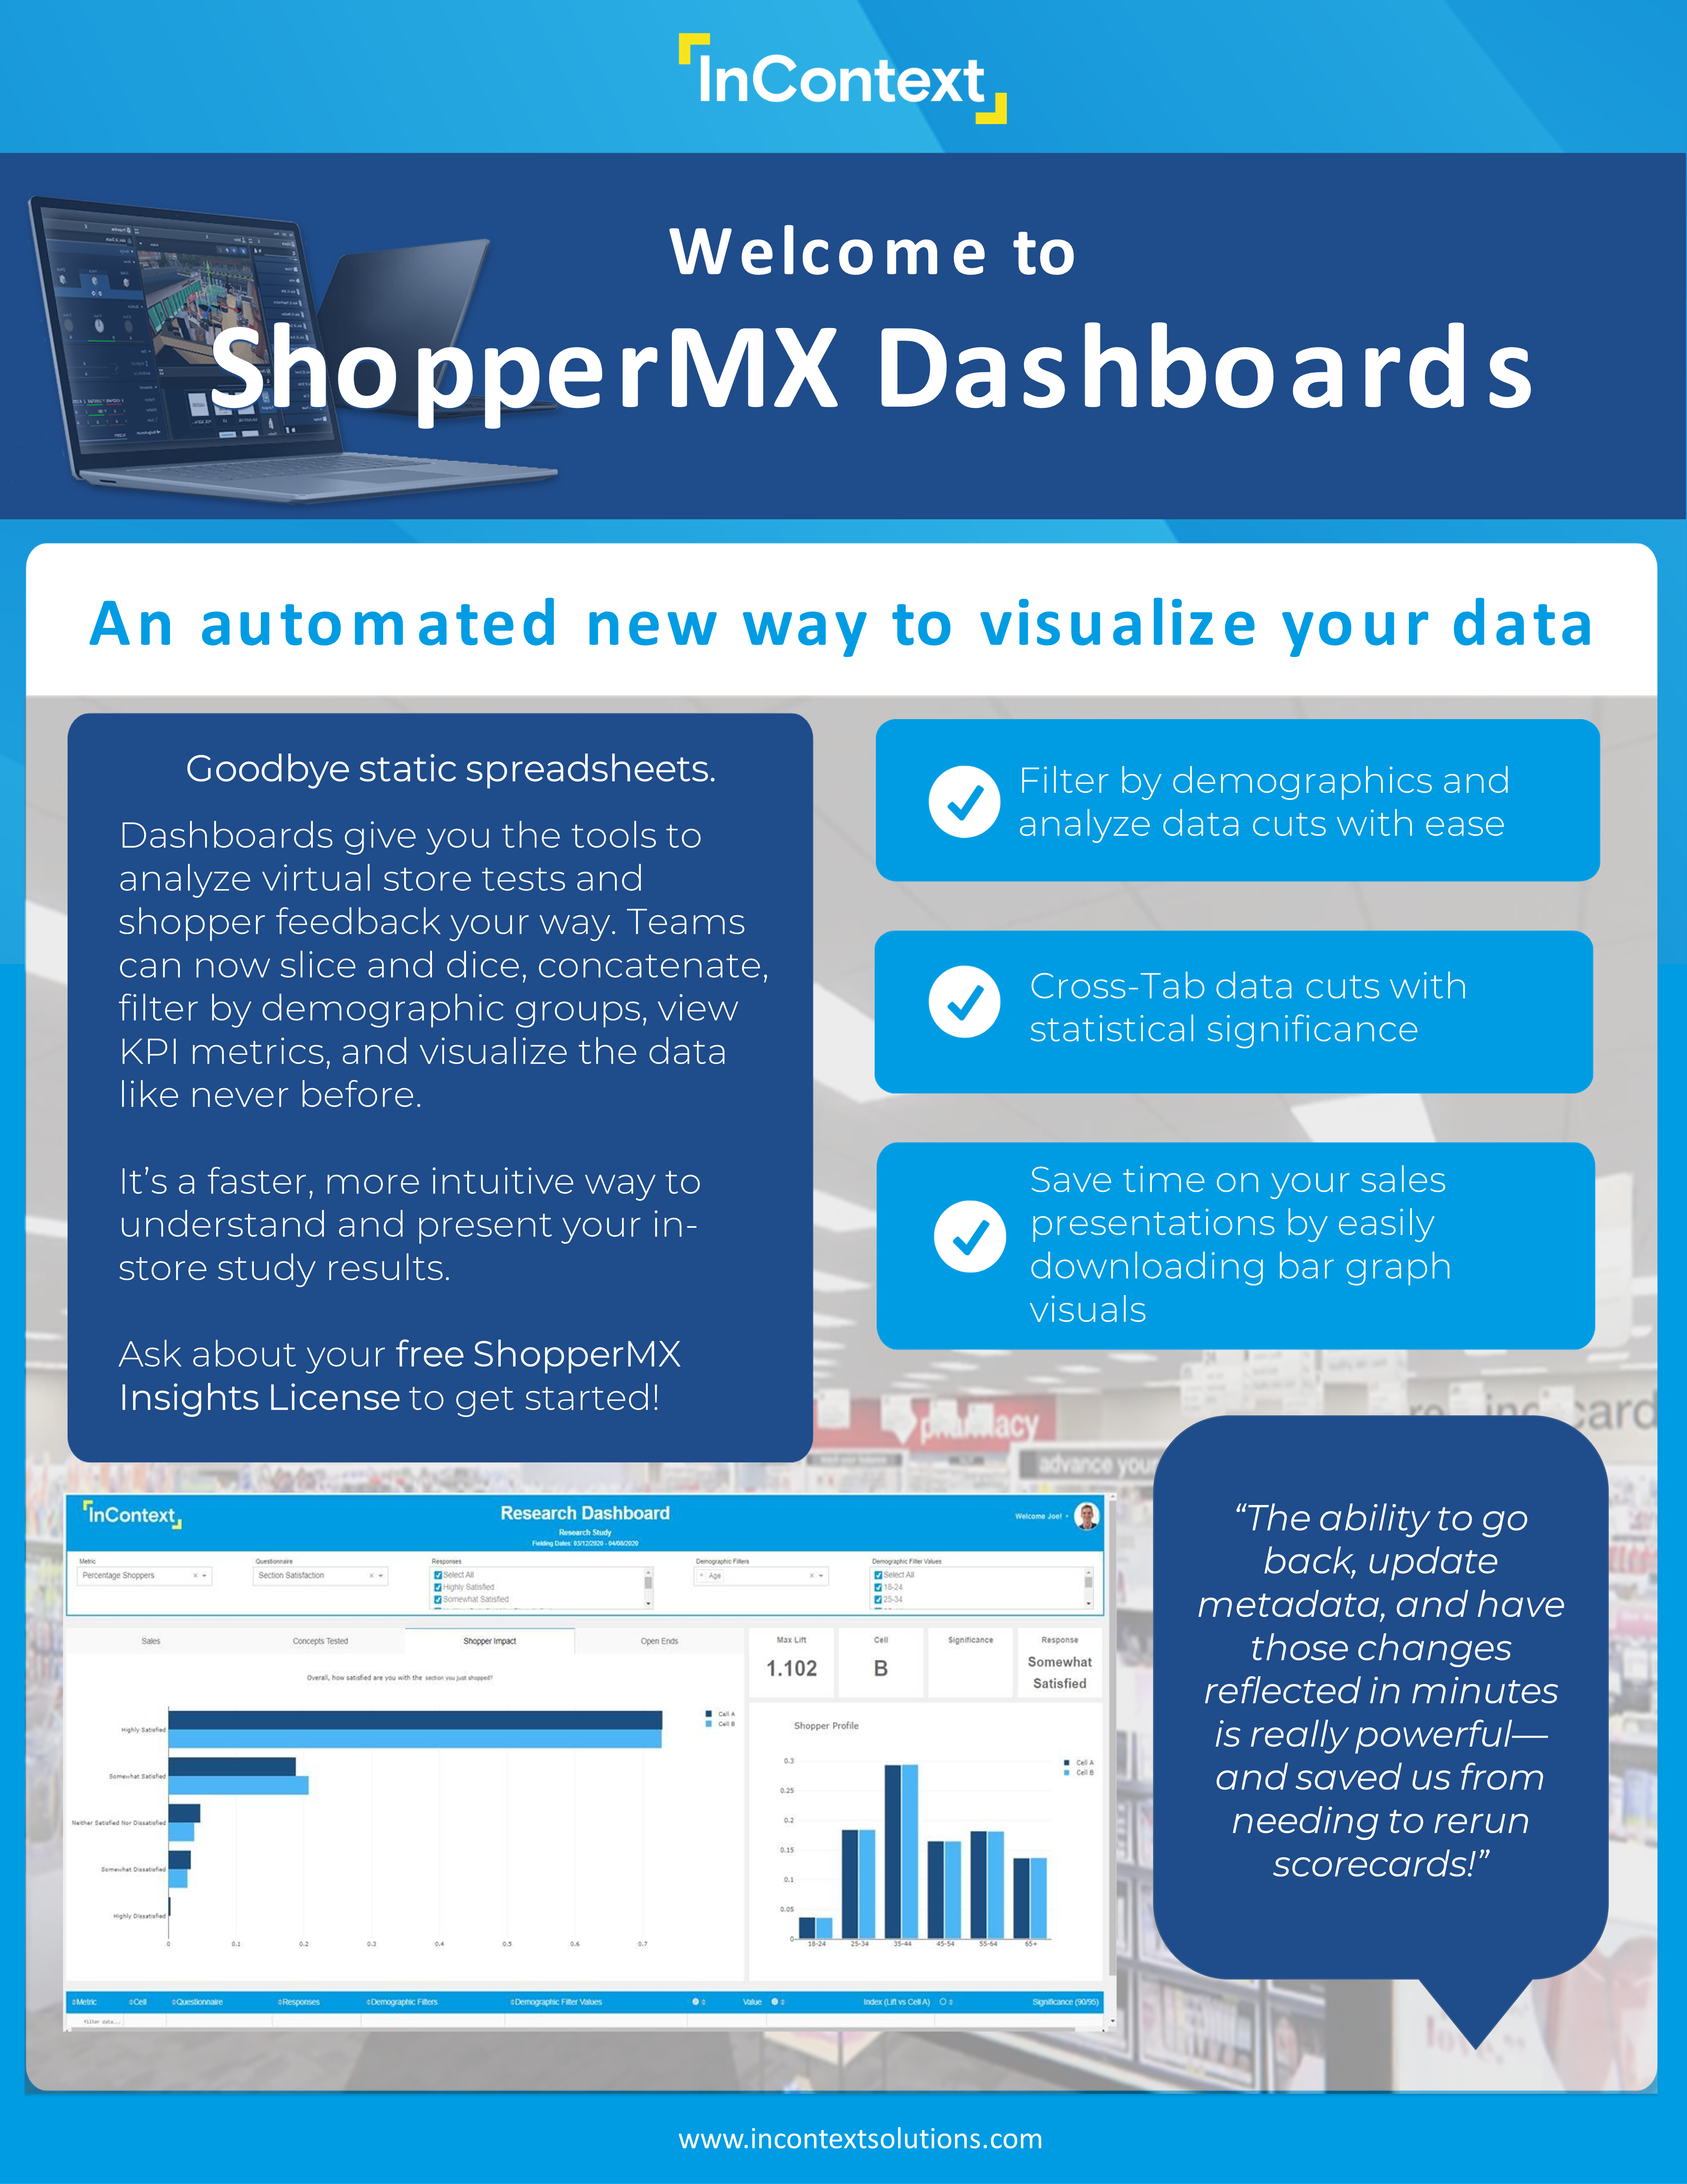
The good news is, with our virtual retail simulations platform, ShopperMX, you no longer need to rely on static Excel files to sift through your study results. ShopperMX Dashboards empower you to analyze virtual store tests and shopper feedback the way that makes sense for your team.
Here are a few of the benefits:
- Clearly visualize your data
- Filter data by demographic, data cuts, and more
- Save time by easily downloading bar graph images for your presentations
- Cross-tab data cuts with statistical significance
- Download your data 3 different ways
Right now we’re offering our customers a free ShopperMX Insights license that gives you the power easily manage and share your data, your way. Contact us to learn more!

